5.3 - What is Board Authority and What is the Effect of Act I?
As part of our review of the major affects of Act 1 on school districts, we now move to another important concept related to the impact of the Act 1 Index on school district property taxes. This concept is called "board authority".
As we reviewed two weeks ago, there is a wide variation in property tax ratios (property tax as a % of total budget) ranging from less than 10% in poor districts that typically rely more heavily on state funding to 85% in wealthy districts that operate primarily on local revenue and wealth. Much like the wide range in property tax ratios, the impact of Act 1 on board authority varies significantly from district to district.
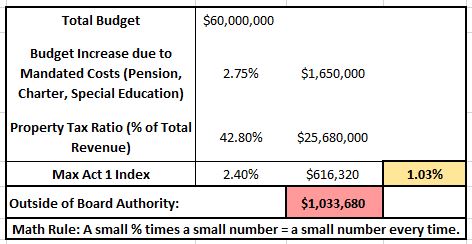
Board authority is the degree to which a change in property tax revenue at the the maximum Act 1 index covers change in their total budget. For example, suppose a school district has a $60,000,000 total budget, relies on property taxes to fund 42.80% of its budget,
and has an Act 1 index of 2.4%. As a result, the school district's "board authority" in the upcoming budget is 1.03% of it's total budget (42.80% x 2.4%). In other words, a maximum increase in property taxes under the index would provide the district's total budget with an additional 1.03%.
Now suppose mandated costs for pension, charter schools, and special education have risen for this school district at the statewide average annual rate (as we've shown in our previous editions) of 2.75% of total budget. These mandated costs would result in $1,650,000 in
additional mandated costs for the school district in the upcoming fiscal year. Taking the 1.03% board authority, the school district can generate $616,320 in additional property taxes without receiving exceptions from the Department of Education (we'll cover how exceptions work later this week).
Mandated costs less board authority represents the amount of mandated costs outside of the board's capacity, which then must either be covered by increased state funding (which typically covers a small portion) or cuts to other educational programs. Illustrated below is a school district with mandated costs
increasing at the statewide 6-year average annual percent change of 2.75%, a total budget funded 42.8% by property tax revenue and an Act 1 index of 2.4% in 2019-20.
Table: Board Authority and Act 1 Index
Because the range of school districts' percent of their total budget is funded by property taxes varies significantly (from 8% to 85%) so too does the range of board authority. Typically, lower wealth districts rely more heavily on state funding and higher wealth districts more heavily on local funding. While the Act 1 index for each school district is adjusted by their MV/PI Aid Ratio (wealth), there is a wide difference between low-wealth and high-wealth school districts in the degree to which the school district has enough board authority and a stable tax base to cover rising mandated costs for pension, charter schools, and special education.
As illustrated below, a low wealth school district with an Act 1 Index of 4.0% on property taxes that fund 21% of its total budget has a board authority of only 0.84% . Meanwhile, a high wealth school district with a much lower Act 1 Index but relies more on property taxes to fund 85% of its budget has a board authority of 1.70%. Additionally, low-wealth school districts are typically one of the 100 school districts losing assessed value annually resulting in a loss of property tax revenue from the prior fiscal year, necessitating the use of Act 1 exceptions to exceed the Act 1 index to stay revenue neutral as mandated costs grow.

Click on the image link below to view our interactive map illustrating for each school district board authority for based on their property tax ratio and their Act 1 index.